Hackathon Challenge
Dell & Nvidia 2024
CrisisShield
Overview
CrisisShield is an AI-powered retail demand forecasting platform that helps retailers adapt to unpredictable crises, optimizing sales forecasts, inventory management, and market changes. It provides real-time insights with a sleek, intuitive dashboard for efficient decision-making.
Timeline
4 weeks
Role
UX Research - Product Design
Tools & Platform
Adobe Illustrator, Figma, Miro, Framer
Challenges
Adapting to market disruptions from crises
Managing inventory during unpredictable demand
Enhancing forecasts with real-time data
Customizable forecasts for regions and retail sizes
User Story
1- On a regular day, a peaceful electronics retail store is buzzing with customers browsing the latest gadgets and devices.
2- Suddenly, breaking news announces a pandemic, urging people to stay indoors and avoid public spaces.
3- The store is now empty, foot traffic has dropped to zero, and sales have plummeted, leading to an overstock situation.
4- The store manager turns to CrisisShield to manage the excess inventory and optimize sales using the platform’s advanced features.
5- Gradually, sales begin to pick up as the platform helps the manager adjust strategies and respond to market changes.
6- Impressed by the results, the store manager recommends CrisisShield to other managers, highlighting its effectiveness during the crisis.
7- Even after the pandemic passes and normalcy returns, the store manager continues using the platform to optimize inventory and stay prepared for potential future crises.
Competitive Analysis
This competitor analysis compares Coupa, Ivalua, and GEP in the retail demand forecasting and supply chain management space. Coupa offers basic AI-powered forecasting and strong supply chain insights but has a complex user interface. Ivalua excels in advanced analytics and procurement management but lacks focus on crisis events and sustainability. GEP stands out with its robust AI capabilities, strong sustainability focus, and intuitive, user-friendly interface, making it highly scalable and adaptable for mid-market and large enterprises.

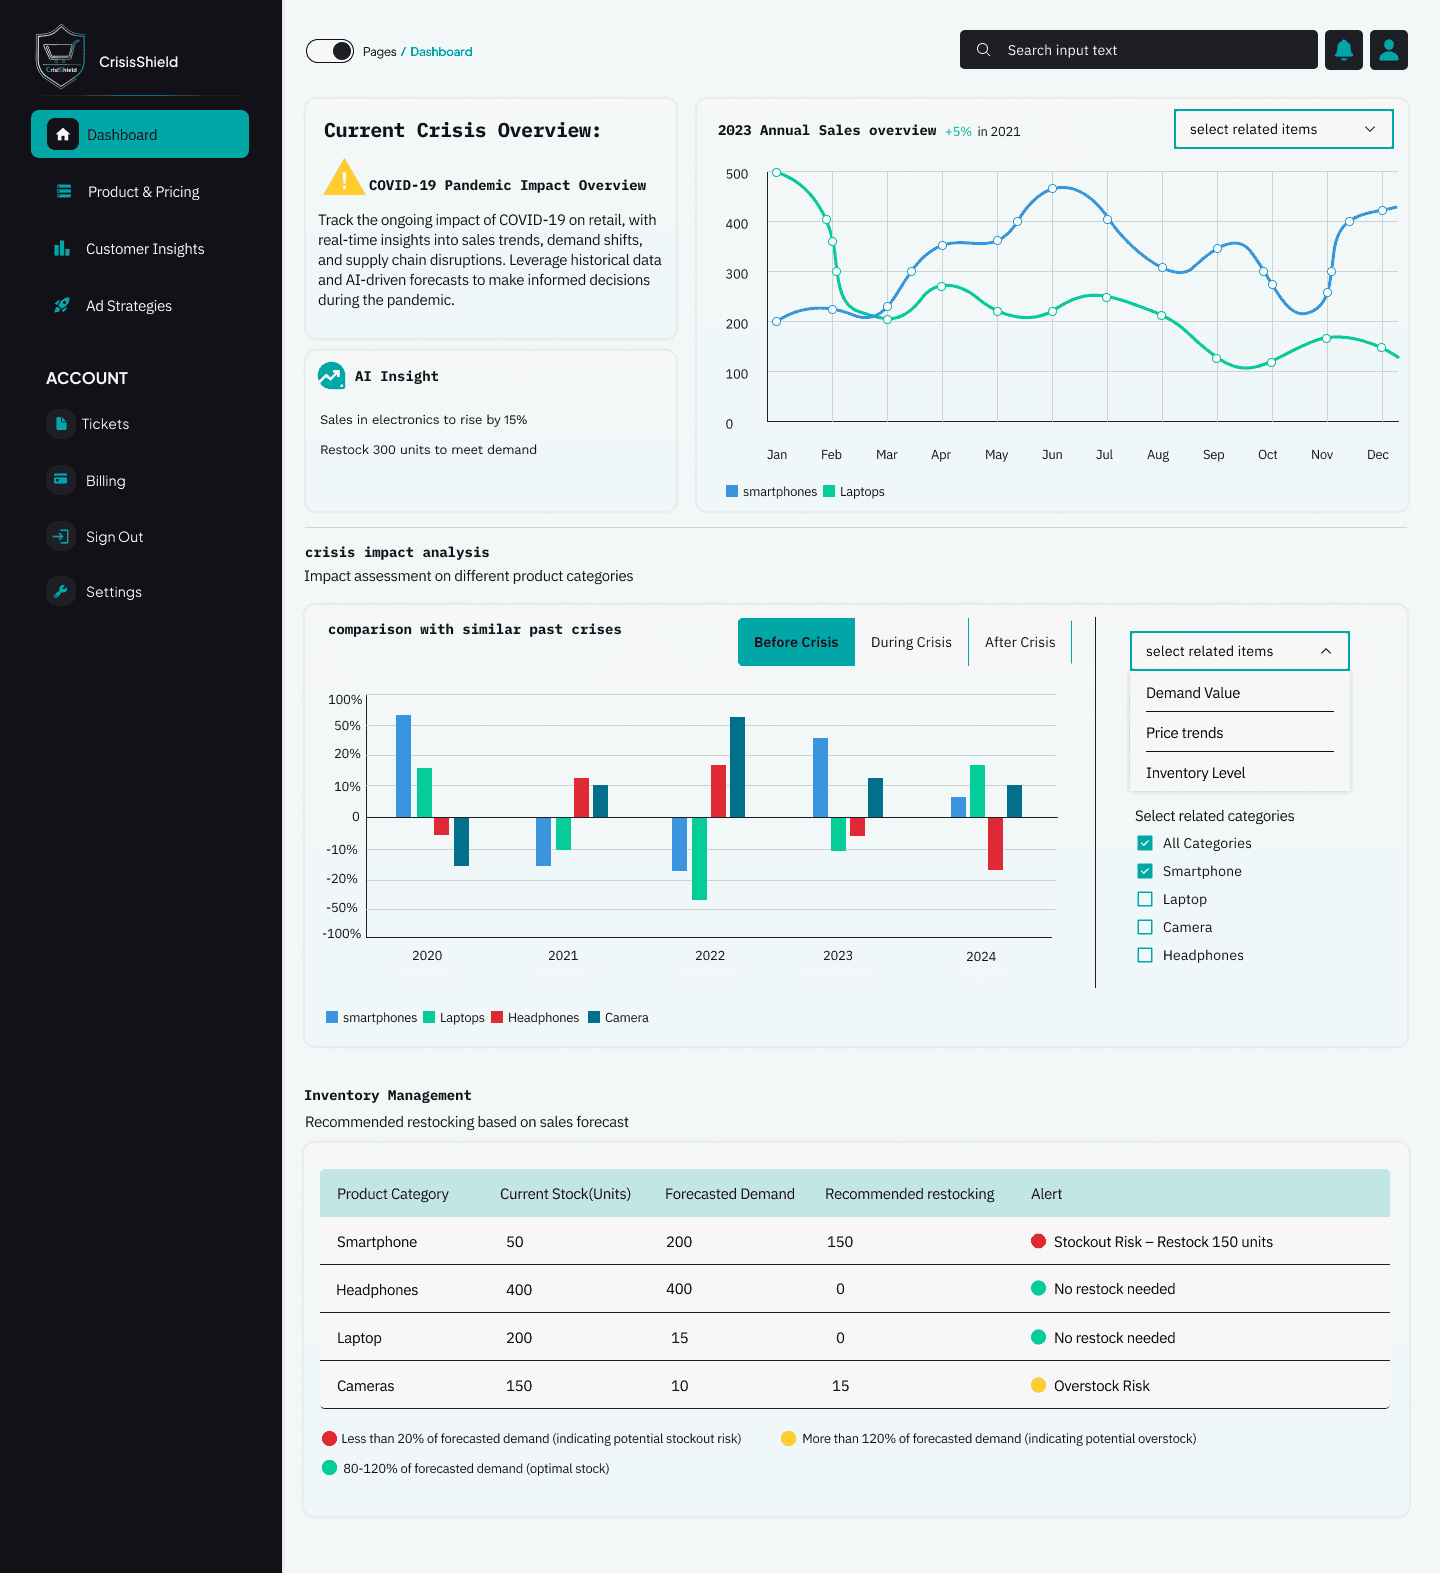
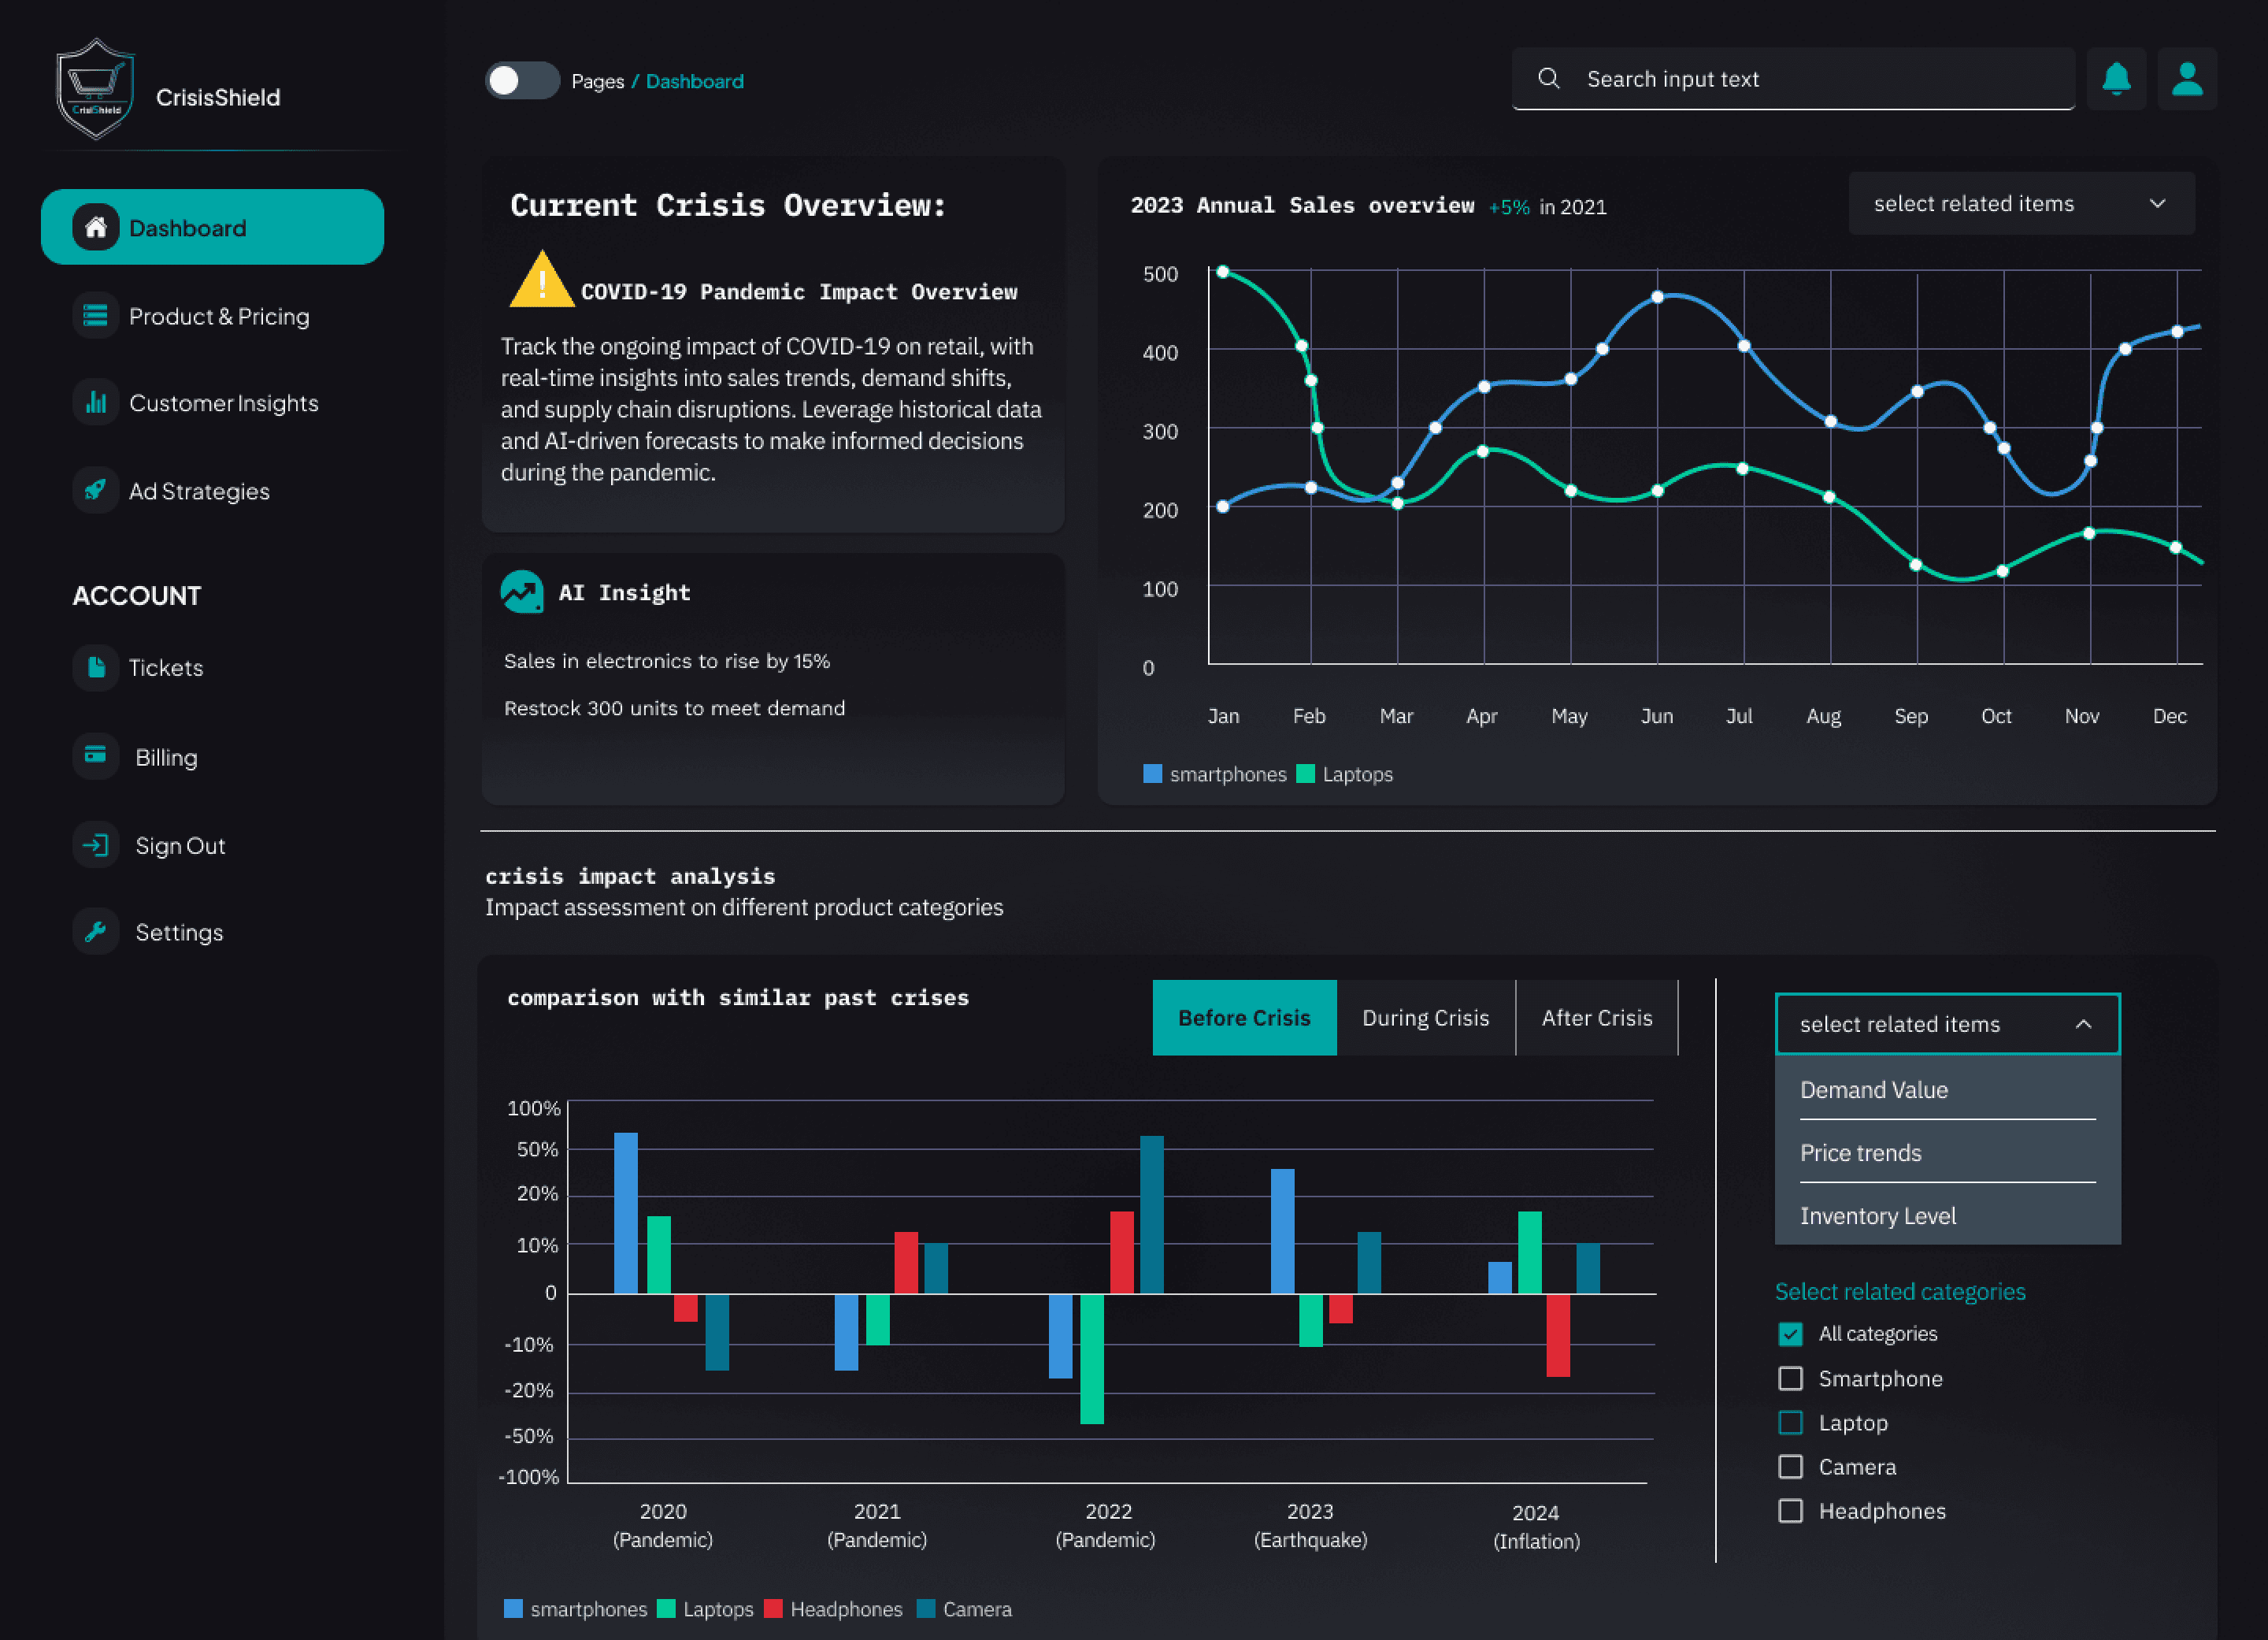
Main Dashboard (Crisis Impact Analysis and Inventory Management)
The main dashboard provides a comprehensive overview of the retailer's current crisis response, offering real-time insights. Key features include:
Crisis Impact Analysis: A dynamic table comparing sales performance before, during, and after crises. Users can filter by product categories and historical crises, visualizing how different products are affected.
Inventory Management: This section tracks product stock levels in real-time. A table displays current stock, forecast demand, and suggested restocking actions, while alert systems notify users of overstock or stockout situations.
Product and Pricing
This page focuses on product performance and pricing optimization during and outside crises. The features include:
Product Performance: Two pie charts compare product sales during a crisis and in regular periods, enabling retailers to see the relative impact on each product category.
Pricing Optimization: A detailed table displaying current prices alongside AI-recommended price adjustments. This feature helps users make data-driven pricing decisions to maximize revenue during and after crises.
Customer Behavior Trends
Annual Sales Trends: This section focuses on comparing sales data for four selected product categories: smartphones, laptops, cameras, and headphones. The line chart shows how each category's sales have fluctuated during different phases of a crisis (before, during, and after).
The chart helps identify trends and predict future behavior for each product, giving a clearer picture of how customer demand varies depending on the situation.
Most Searched/View Products & Average Transaction Value
Most Searched/View Products: This bar chart ranks the most searched or viewed products, showing the interest of customers during the crisis. It compares different product categories such as smartphones, laptops, headphones, and cameras. This data helps retailers understand which products customers are most interested in.
Average Transaction Value (ATV): The column chart compares the average transaction value for the most searched products, categorized by product type, before, during, and after the crisis. It provides a comparison of how much customers are willing to spend during different crisis stages for each product category.
For the Marketing Insight feature of the CrisisShield platform, users follow a three-step process to create and manage campaigns:
1- Campaign Selection: Users decide whether to run a short-term or long-term campaign. They can customize their campaign focus across four categories—Price, Product, Placement, and Promotion—with the option to select all.
2- Timeline Definition: For short-term campaigns, users can choose durations such as one week, multiple weeks, or one month. Long-term campaigns allow for a more extended timeline, typically several months to align with seasonal strategies or company objectives. The start and end dates are set in this step.
3- Promotion Cards: Based on the chosen period and campaign type, the platform generates promotion cards. For example, during the back-to-school season, users may see promotions for school-related products. Each card includes details about discounts and the suggested marketing channels (e.g., email, LinkedIn, Instagram). With a simple push of a button, users can integrate these changes into their existing marketing platforms, streamlining the entire campaign execution process.


